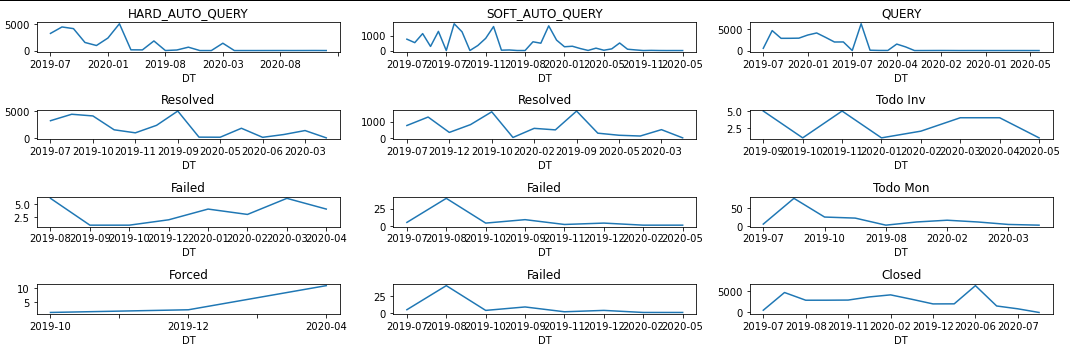
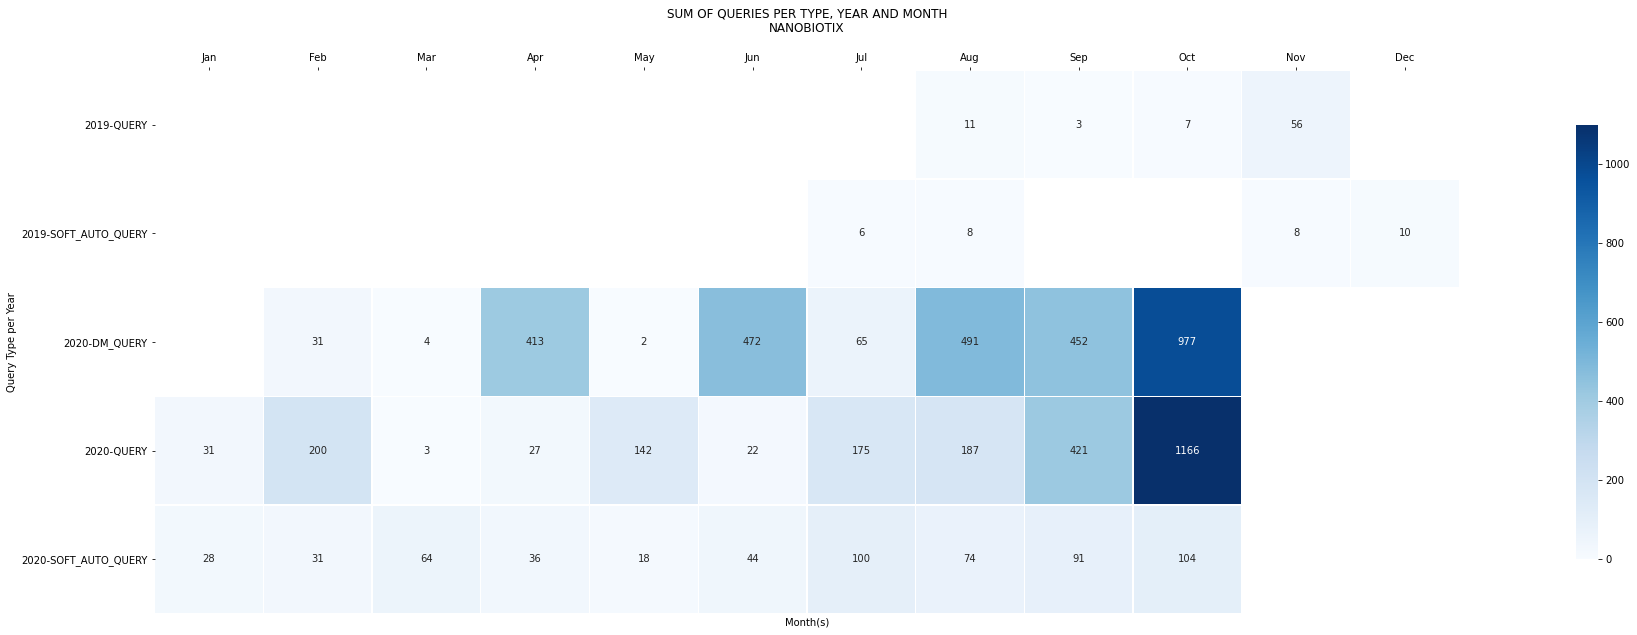
Queries
- A, B, C, D -- represent Site labels
- y-axis -- shows the percentage of max data entry activities
- x-axis -- shows the runtime of the trial
In this little exercise I tried to find an answer for that question by analyzing the data entry activities grouped by Sites. So the next time someone asks about the trial status I can answer "According to our 'Trial Heart Rate' everything seems to be alright.". Of course you can use the same approach to analyze and compare different trials.
..::[How]::..
I will share the python code on my GitHub
- Python
- Pandas
- Numpy